.png)
If you have not already done so, please read all disclaimers, as the following report is not intended as a financial recommendation.
Although Indexes have now been in consolidation since mid-October, the underlying macro-economic situation has evolved quite substantially over the past several weeks. Firstly, the Supreme Court through a 6-3 decision nullified the IEEPA tariffs without specifying the implications on the tax revenue already collected from the tariffs (~134B). Treasury Secretary Scott Bessent made a few weekend appearences across the MSM landscape to suggest that the revenue would be made up through the usage of additional statutory tools (i.e. Sections 232, 201, 301, 122 and 338). These options are certainly more narrow in scope than the previous implementation, but could, in theory, make up the outstanding difference. It is important to note that each of these provivisions will require a different set of legal overhead (i.e. official federal investigative reports), and may be further restricted with a potential timeline (i.e. 201, 301 and 122). Expect further legal challenges and more policy confusion as to the implementation for businesses.
Seperately, The Bureau of Economic Analysis (BEA) released their Q4 and December economic numbers. Based on their reports, Q4 GDP came in at 1.4%, 1.4% less than the consensus estimate of 2.8% and below last quarters GDP of 4.4%. Notably, this time period did encompass the Federal Government Shutdown. Also interestingly, Personal Spending and Personal Income both beat expecations suggesting some more resiliency in the US consumer. All in all, the economic picture is quite mixed with significant noise preventing clear and confident insights from being extracted by traditional economic models.
A key component of this confusion has recently also been the impact of AI on SaaS companies, the labor market and the broader global economy. Citrini Research released an extremely thought provoking article this last week describing a possible timeline of tremendous labor and capital dislocation triggered by a doomsday loop of increased (and forced) AI investment to productivity-induced layoffs. Although jarring, we attribute a higher likelihood to a scenario where AI delivers nascent industries (ex. Robotics, Biotech, Material Science, Space Exploration, etc.) that bolster the economic prospects substantially further after an initial period of disruption. Capital markets will undoubtedly be rocked by an AI-induced labor/capital dislocation, but this ultimately will be a dip-buying event for the long run. We think it would be a tremendous mistake to underestimate the potential of US-based innovation to fill the temporary gaps in supply and demand that may be invoked by the worlds largest companies reacting to the progress of AI. As highlighted in our last report, we continue to prepare and maintain a large cash position on standby to deploy strategically at S&P500 drawdowns of 12%, 18%, 24%, 33% and 47% based on historical market patterns.
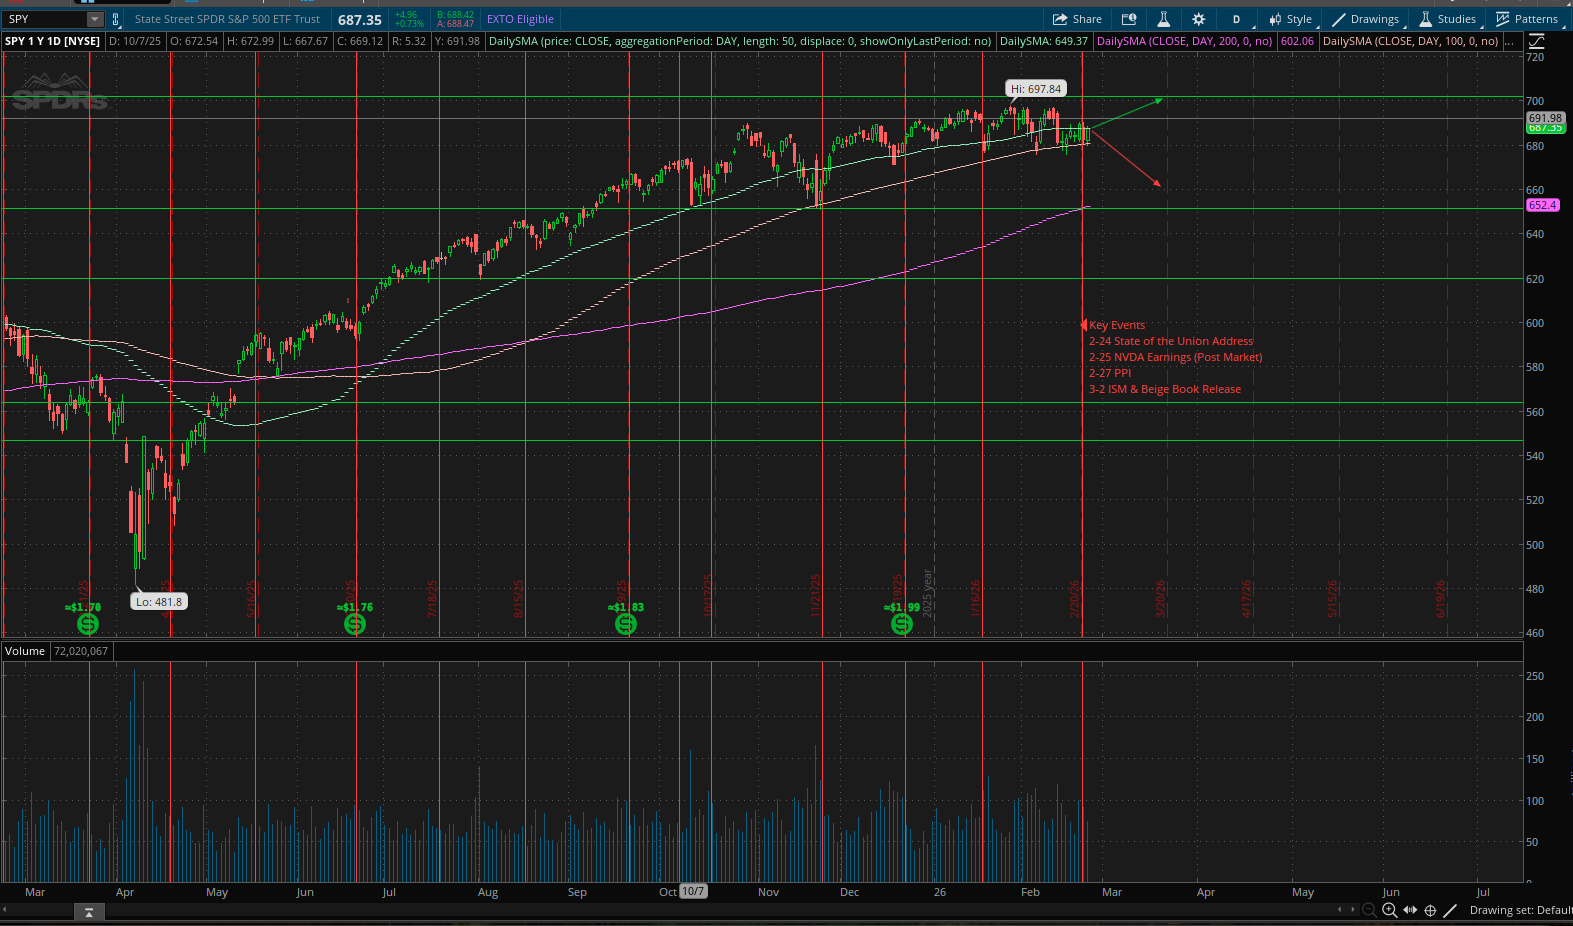
Indexes have continued to be held rangebound alongside tremendous amounts of dispersion. The Volatility Index (VIX) continues to persist around the key 20 level, with constant threat of headline risks during this seasonally weak period (Feb to March OpEx), hedging does seem to be prudent. Look for the State of the Union (2/24/26) and Nvidia's earnings (2/25/26 afterhours) to mark potential inflection points out of this range.
Below we will provide updates on select positions:
| Weight | Ticker | Avg Cost |
|---|---|---|
| 8.39% | TSLA | $296.83 |
| 6.25% | GOOG | $209.51 |
| 5.79% | FICO | $1594.55 |
| 5.25% | MSCI | $550.71 |
| 4.97% | EFX | $214.01 |
| 4.74% | ASML | $756.09 |
| 4.13% | MOH | $167.86 |
| 3.94% | JNJ | $162.66 |
| 3.84% | MCO | $429.27 |
| 3.66% | BTI | $38.20 |
| 3.54% | RDDT | $159.09 |
| 3.44% | PM | $181.57 |
| 3.44% | V | $326.35 |
| 3.39% | MA | $537.28 |
| 3.36% | SPGI | $378.69 |
| 3.36% | APP | $477.73 |
| 3.11% | CBOE | $192.16 |
| 2.67% | BRKB | $510.22 |
| 2.34% | MSFT | $414.12 |
| 2.32% | ROL | $47.07 |
| 2.18% | MAR 13 2026 QQQ $565 PUTS | $3.48 |
| 2.05% | AXP | $282.70 |
| 2.04% | FNMA | $10.59 |
| 1.96% | NKE | $61.01 |
| 1.94% | TGT | $98.60 |
We will provide our next update on 3/22/26. Please follow our X Account for the latest @ap_analytics_cm. As always, feel free to reach out to anish@ap-analytics-cm.com to discuss any of these items.
Anish G. Prasanna
If you have not already done so, please read all disclaimers, as the following report is not intended as a financial recommendation.
With just a few trading days remaining in 2025, we would like to outline the broader themes that are likely to shape the economy and markets over the next year. The K-shaped economy has been widely discussed and litigated in the media over the last several months, specifically regarding its expression in the economic data. Labor market data continues to demonstrate signs of weakness, while AI-related CapEx continues to boom with roughly 80% of the nation's GDP directly tied to AI-related spend. Frankly, this level of concentration in one sector is a dynamic that many experts continue to present as either an economic panacea or a DEFCON 1 scenario, but in reality, a smarter approach is to view it in a probabilistic manner. Although the risks of a severe labor market disruption, energy constraints, an unwind of the AI arms CapEx race, and a shift away from Data Center buildout to edge device inference could all materialize either in narrative or reality, those events are likely to present a great opportunity to accumulate high-quality, predictable, compounding businesses. For this reason, given the upside and downside tail risks, the approach we will aim to execute over the next several years involves 3 core legs: 1) A large cash position to deploy strategically at S&P500 drawdowns of 12%, 18%, 24%, 33% and 47% 2) Accumulation of predictable quality businesses that have large runways to grow due to entrenched moats (i.e. regulatory, etc.) 3) Concentration in companies heavily levered to AI adoption.
The above dynamics also are at risk of further exaggeration due to record low cash positioning by investors (<3%), and record high levels of margin utilization. Although these factors do not suggest immediate risks, they are key details to track given the markets stagnation around all-time highs since late October. Recent Bureau of Labor Statistics (BLS) data suggested that November's Unemployment rate (4.6%) is now past the Fed's long-run target of 4.2% and 2026 year-end target of 4.4% as stated in their December 10th Summary of Economic Projections (SEP). As a reminder, Unemployment has historically largely moved in a non-linear fashion. Although some economists have rationalized this increase as an occurrence associated with the rise in the labor force participation rate, macroeconomic forecasting is a tough gig. Once the issues present themselves as clear in the data, resolution is extremely difficult because it is already too late. Although we do analyze these datapoints closely, our approach is to use this data to better assist in navigating ourselves to meet our strategic goals (accumulation in high-quality, predictable, compounding businesses).
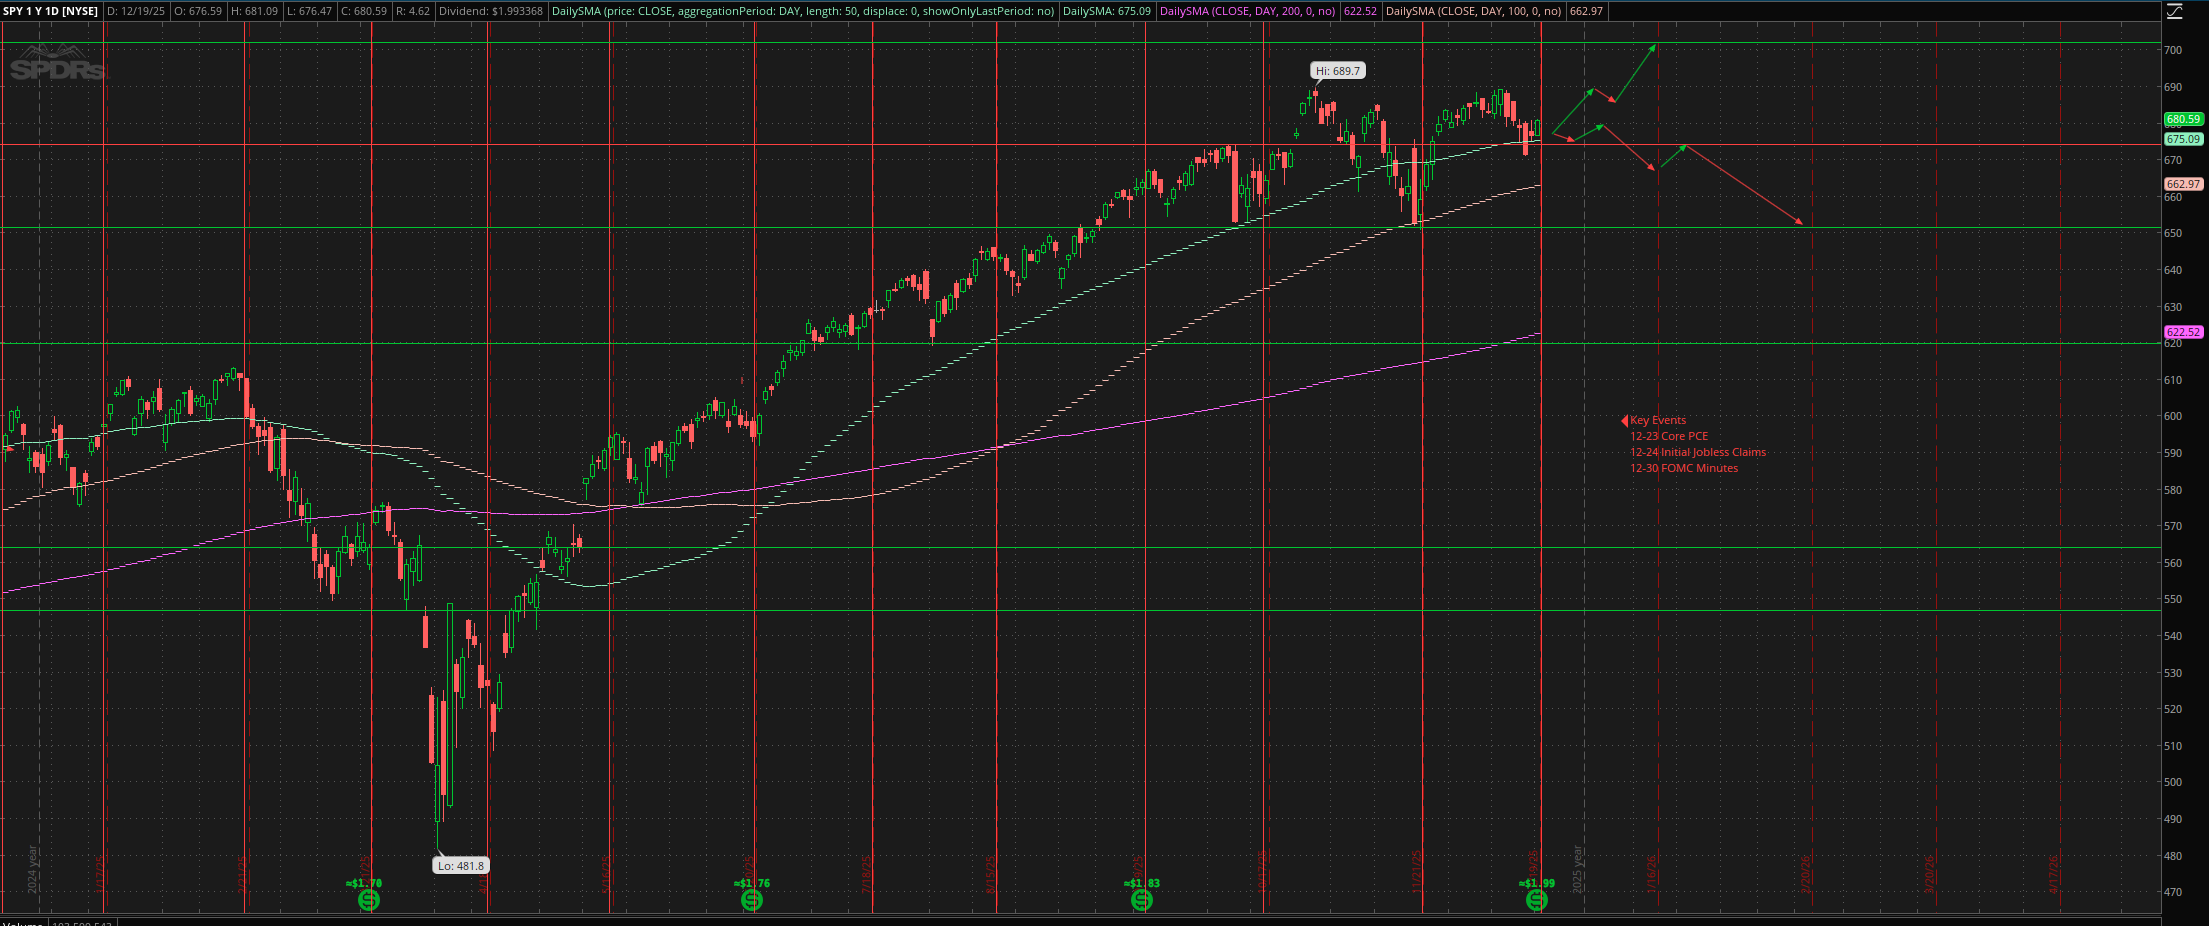
Indexes have largely been held rangebound thanks to economic data being accomadative in conjuction with the VIX stablizing from its breakout over 20 last month. The S&P 500 bounced off the 100 Daily Moving Average (DMA) around November OpEx, and returned briefly to All Time Highs on 12/11/25. Given the nature of December OpEx we would expect some unpinning to allow for a move to 700 as part of a "Santa Rally", or a short term pullback. Most likely, however, a significant (>5%, >10%) pullback would happen after the New Year around the January or February OpEx period. Key Catalysts to be aware of would be the Supreme Court's decision on President Trump's IEEPA tarriffs, and an announcement of the next Federal Reserve Chairman. According to Kalshi, it's now a 3 man race with Hassett, Waller and Warsh. Waller would be the market's favored pick due to consensus building potential, followed by Hassett and Warsh who would both be seen as more political in nature.
Below we will provide updates on select positions:
| Weight | Ticker | Avg Cost |
|---|---|---|
| 12.19% | TSLA | $296.83 |
| 9.25% | AMZN | $227.83 |
| 7.62% | GOOG | $209.51 |
| 7.21% | APP | $477.73 |
| 6.84% | RDDT | $159.09 |
| 6.82% | MSCI | $568.80 |
| 5.55% | EFX | $220.94 |
| 4.23% | ASML | $755.32 |
| 4.17% | JNJ | $162.66 |
| 4.08% | BTI | $37.90 |
| 3.50% | FICO | $1783.12 |
| 3.37% | FNMA | $10.59 |
| 3.32% | CBOE | $192.16 |
| 2.82% | ROL | $47.07 |
| 2.77% | AXP | $282.52 |
| 2.43% | UNH | $302.20 |
| 2.29% | MOH | $162.65 |
| 2.19% | OXY | $39.62 |
| 1.85% | KO | $60.08 |
| 1.62% | CME | $222.45 |
| 1.45% | CB | $306.27 |
| 1.38% | MO | $45.01 |
| 1.36% | GT | $8.93 |
| 0.86% | JMIA | $12.91 |
| 0.69% | FMCC | $10.73 |
We will provide our next update on 1/18/25. Please follow our X Account for the latest @ap_analytics_cm. As always, feel free to reach out to anish@ap-analytics-cm.com to discuss any of these items.
Anish G. Prasanna
If you have not already done so, please read all disclaimers, as the following report is not intended as a financial recommendation.
Both the market and broader economy demonstrated signs of turbulence these last several weeks. Firstly, the longest-ever Government Shutdown concluded after results from notable special elections were finalized, creating a mass backlog of economic data that will continue to be released in the coming weeks. The first key indicator was the September Non-Farm Payrolls (NFP) report that was encouraging, but only at face value. The report showed a gain of 119k jobs (higher than the anticipated 53k), but the underlying data showed negative revisions (for the second time this year) and that the Unemployment Rate ticked up to 4.4%. Additionally, globally, Japan continues to show similar signs of fiscal and monetary stress. Japanese Government Bond (JGB) Yields continue to rise higher increasing concerns about the implosion of the "Yen Carry Trade". Yields continue to hang below inflation, however, so investors likely still prefer US equities. We continue to monitor this situation as it keeps evolving. Moving in a different direction, market internals suggest that breadth has totally collapsed, with a record-low number of stocks trading above their 200-day moving average. This is a sign of extreme market weakness, and suggests that the market is likely to be rangebound or even detriorate until we see a significant improvement in breadth. Given the seasonal period of strength, the market should hold here until early next year (Jan/Feb Op-Ex), but black swans like the Supreme Court ruling on IEPPA Tariffs, or a hawkish SEP could be the straw that breaks the camel's back.
Notably, we also received updated positioning disclosures filed via 13Fs for Q3. Duquesne (Druckenmiller) initiated longs in AMZN, META, GEV, and ARM, while cutting exposure to PM and MSFT. Coatue bought GOOG, AMAT and SNOW, while selling out of ARM, AMZN, NVDA and PM. Lastly, Berkshire Hathaway (Buffett) also initiated a position in GOOG, added to CB, and sold significantly out of AAPL, and BAC. Smokeless tobacco continues to be a thematic trend we seek to gain exposure to, but for the time being our PM position was used to fund an upcoming binary event in CAPR. However, we will be looking to add to PM on any pullback, as the company continues to execute well and is likely to see a favorable regulatory backdrop with this administration. Institutional interest in Google was well anticipated by us in July, due to the company's strong fundamentals, significant stake in SpaceX and Anthropic, leading GenAI models, world-class hardware development team, and return of founder Sergey Brin. We are extremely glad to see that this is now being reflected in the stock price.
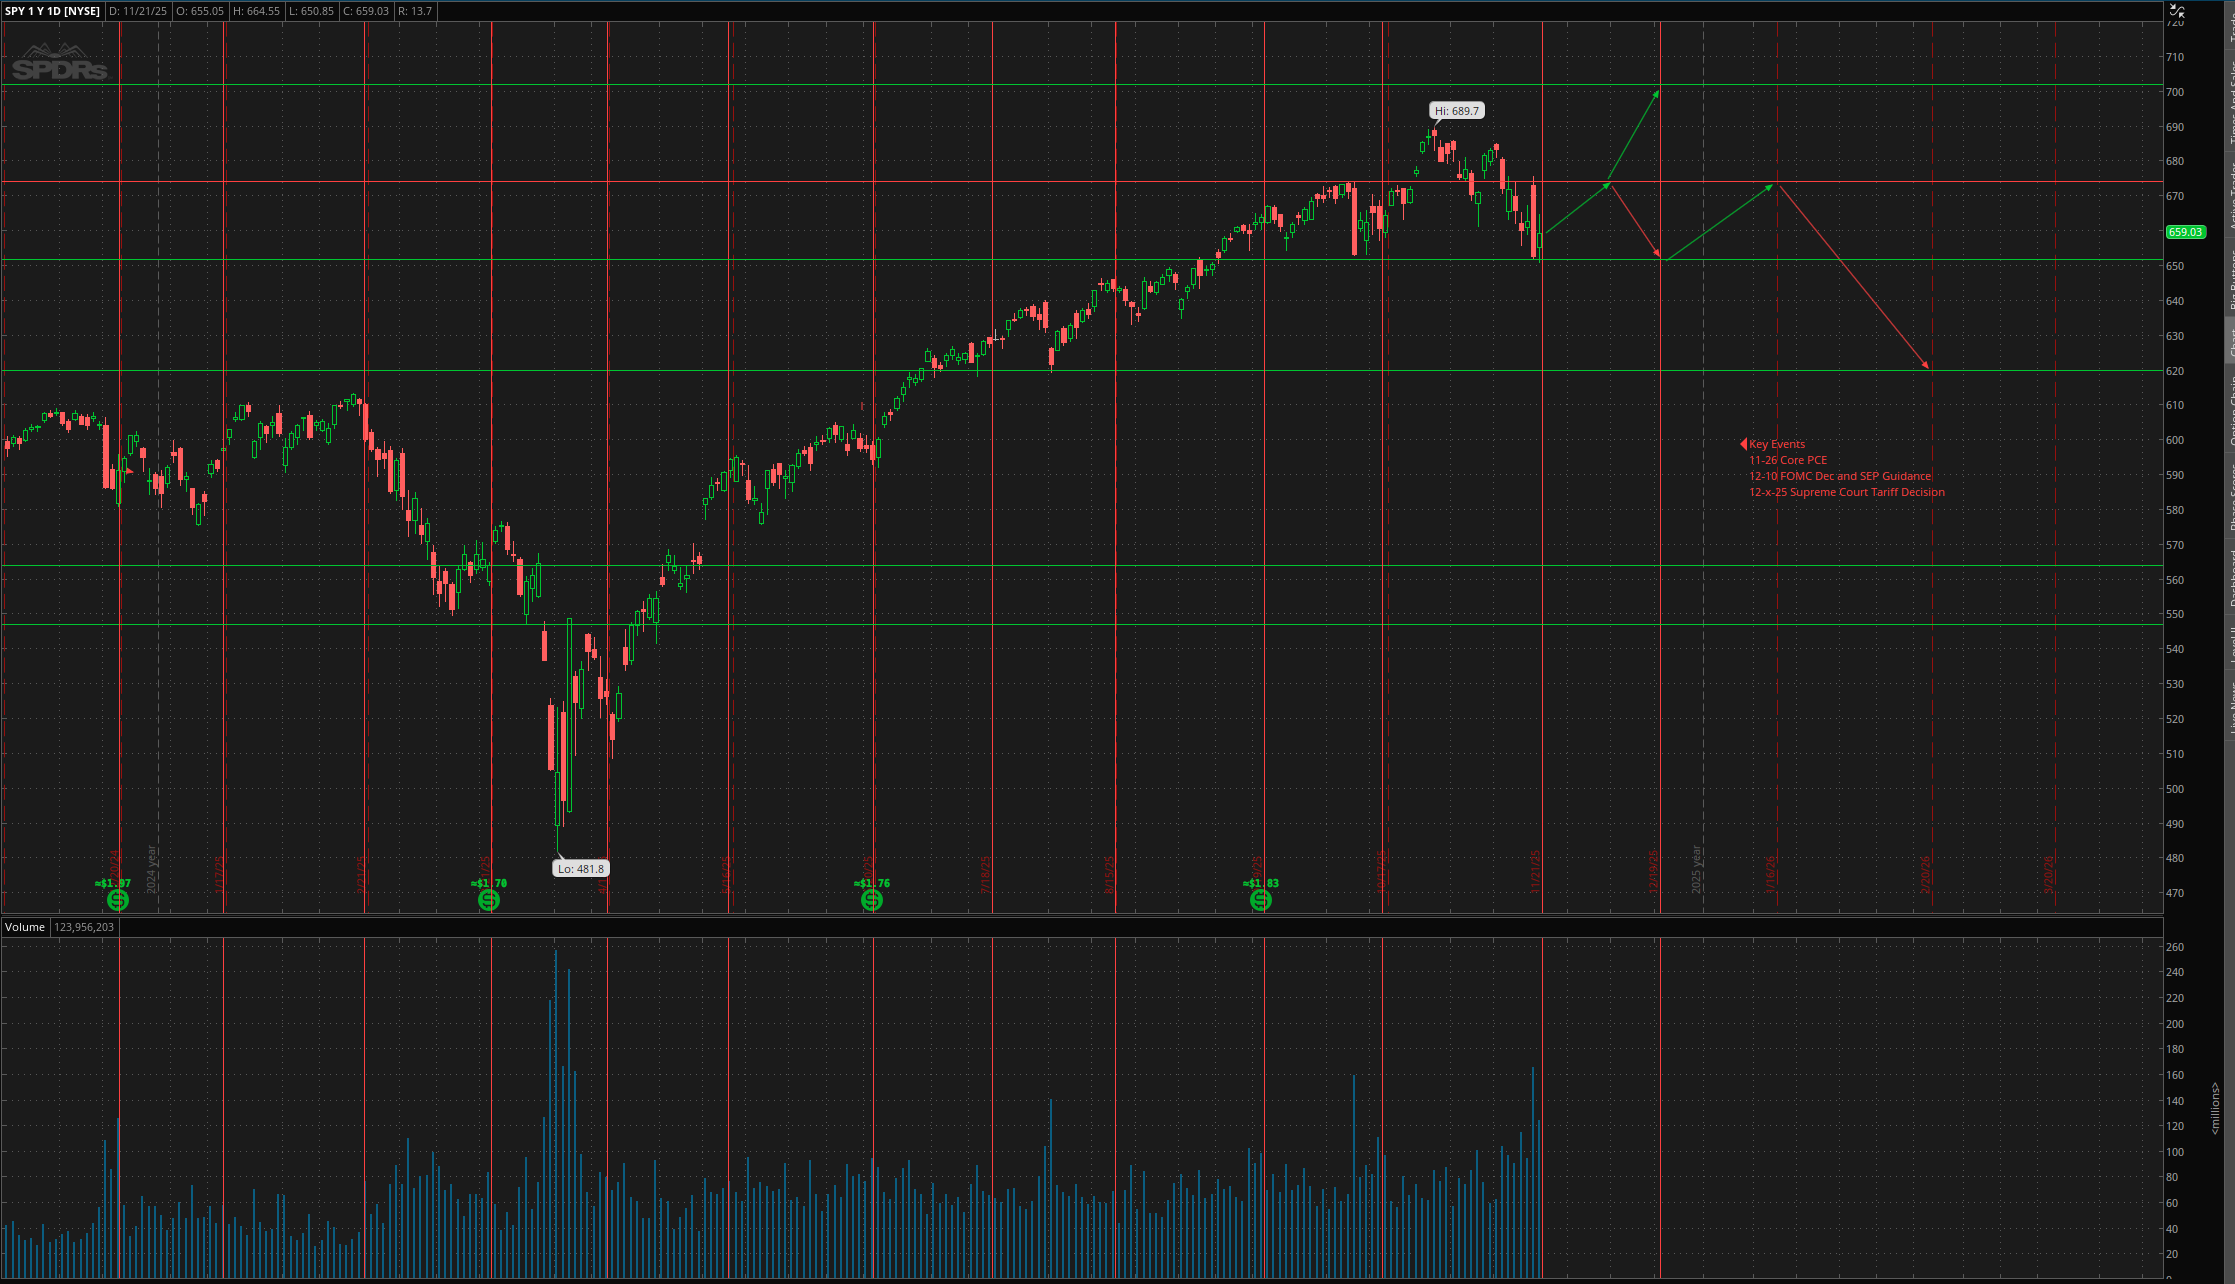
Indexes broke below key support levels last week, with the S&P 500 (SPY) closing several days below the 50 DMA on Monday, yet they did start to show some signs of life with the hold over the 100DMA. With the VIX quite sticky over the key 20 level (23.43), plenty of "Vol Crush" fuel exists to power this market forward into year end, provided concerns about the Federal Reserve's reaction to the deteriorating labor market are alleviated at the December 10th meeting. The market anticipates roughly a 70% chance of a 25bp, which seems likely with at least Miran, Williams, Bowman and Waller likely on the cut side. With risk disproportionately skewed towards a deteriorating labor market continuing, it seems likely that at least another 3 governors flip. The key here is the Fed's guidance shown in the Summary of Economic Projections (SEP) this quarter. A "Hawkish" cut is likely to throw cold water on the year-end rally, but we anticipate a bounce into this meeting regardless, given the sentiment washout, buyback window resuming, Unemployment now at 4.4%, and the dovish comments by Fed governors. Below are a few likely scenarios for how this plays out.
Below we will provide updates on select positions:
| Weight | Ticker | Avg Cost |
|---|---|---|
| 7.83% | CAPR (SHORT) | $6.35 |
| 5.18% | TSLA | $296.83 |
| 4.94% | QQQ | $534.02 |
| 4.77% | AMZN | $219.52 |
| 3.87% | GOOG | $209.44 |
| 3.04% | ANET | $92.77 |
| 2.97% | NVDA | $185.82 |
| 2.81% | RDDT | $151.69 |
| 2.60% | APP | $459.79 |
| 2.55% | META | $666.21 |
| 2.39% | JNJ | $162.37 |
| 2.38% | D | $50.02 |
| 1.96% | BTI | $37.90 |
| 1.86% | TPB | $75.95 |
| 1.81% | ASML | $755.32 |
| 1.79% | BMNR | $49.56 |
| 1.79% | AVGO | $267.15 |
| 1.76% | ROK | $244.86 |
| 1.67% | MRVL | $68.33 |
| 1.66% | FICO | $1749 |
| 1.64% | SNDK | $123.05 |
| 1.58% | CBOE | $191.98 |
| 1.54% | PSTG | $57.67 |
| 1.53% | ARM | $139.50 |
| 1.51% | FNMA | $10.59 |
We will provide an update next month (12/21/25). Please follow our X Account for the latest @ap_analytics_cm. As always, feel free to reach out to anish@ap-analytics-cm.com to discuss any of these items.
Anish G. Prasanna
If you have not already done so, please read all disclaimers, as the following report is not intended as a financial recommendation.
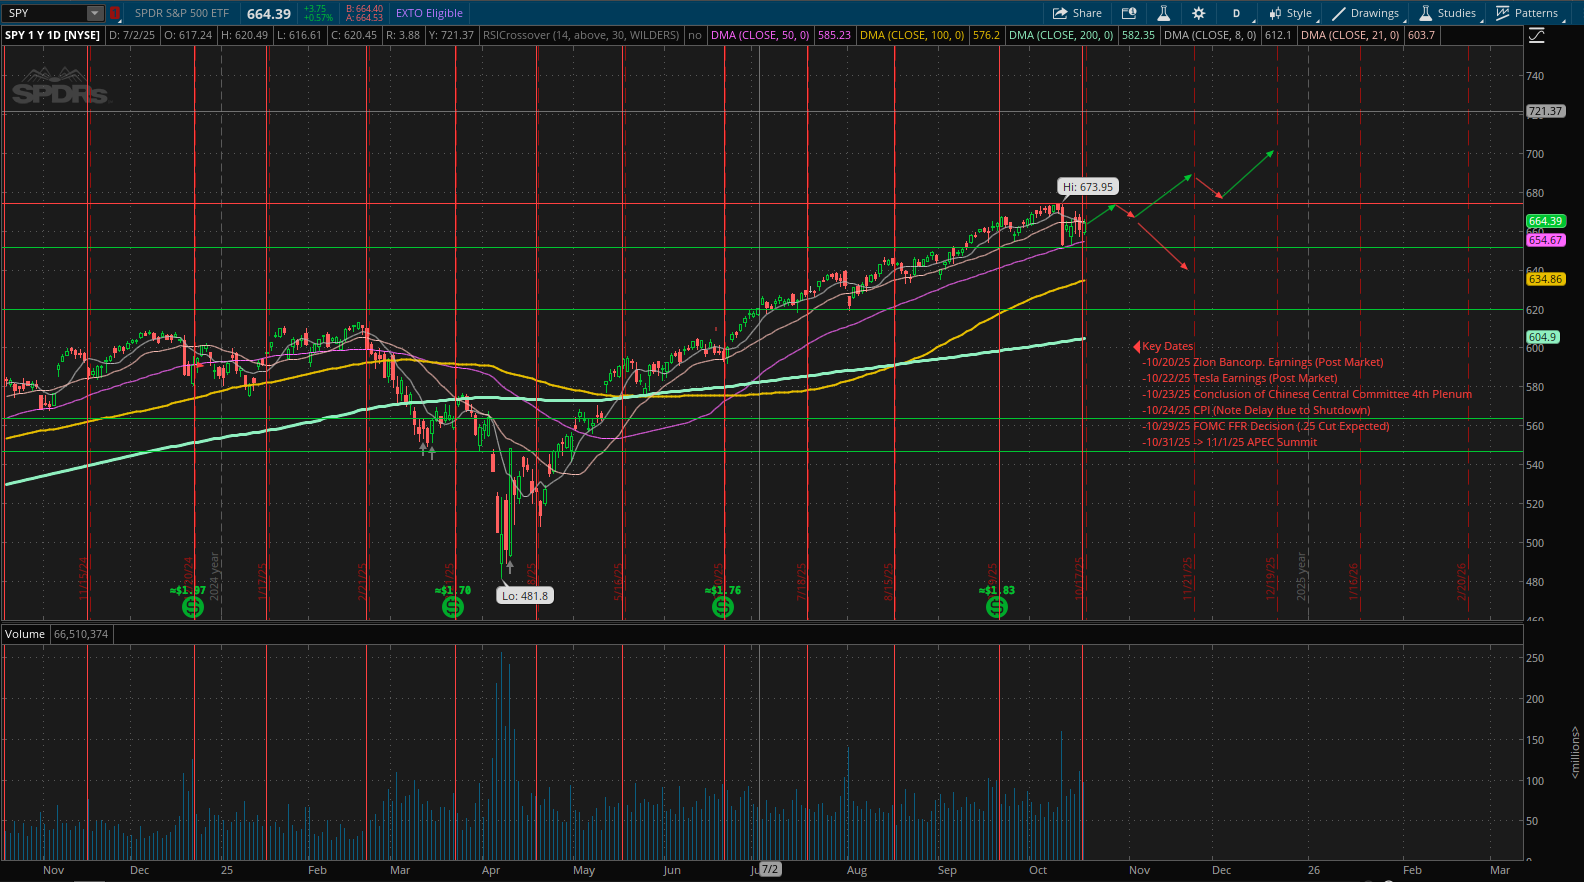
Markets continue to grind higher as the seasonal Q3-Q4 period of weakness comes to an end. Economic headwinds such as the Federal Government Shutdown, Regional Banking weakness, a static Labor Market, and US-China trade front continue to loom large, but until the effects of these concerns are noticed in the data, the market is likely to be buoyed by the corporate stock buyback window reopening, a positive earnings season and wealth effect releveraging from the pretty solid year for US Stocks. In our view, the shutdown is likely to persist until a catalyst emerges, similar to how the 2018 shutdown resolved with TSA and Air Traffic Control going on strike. Key upcoming dates include October 31st (when Service Members paychecks will no longer be covered), and Thanksgiving Week (where travel will surge yet will still need to be managed by TSA, who won't be covered). Kalshi Predictive Markets suggest a November 14th resolution, but these things usually go slowly until they don't. With regard to Regional Banks, Zion Corp. will report earnings after market close on Monday. We don't believe there are systemic issues associated with the credit risks described over the last several days, but this is a situation worth monitoring. In any case, the Federal Reserve should continue to be on standby to provide additional liquidity through new or existing facilities if any increased risk does emerge. Additionally, the emergence of this concern also provides the Federal Reserve further reason to push forward with the cutting cycle through their next meeting on the 29th of October. Although 25 Basis Points is the consensus, look for Governor Miran and even potentially Waller to push for a 50 Basis Point cut.
Last week, we also received the release of the Federal Reserve's Beige Book, which reports the economic health of 12 districts within the USA. Conditions varied by district, but notably more districts reported softening consumption than those which noted growth. Districts cited trade uncertainty, tariffs, high interest rates and the shutdown as their key concerns for future growth, adding to the growing dataset of evidence that the Federal Reserve should move forward with cuts. While Mainstreet continues to suffer from a restrictive Fed, Wallstreet kicked off earnings season last week with several Major US Banks reporting earnings. Bank of America, JP Morgan, Citigroup and BlackRock all smashed earnings and cited that the key consumer segments continue to remain resilient. Additionally, American Express doubled down on these claims with their expansive dataset of middle and upper income consumer spending, which continues to grow materially. Expect earnings season to continue to be positive, which given the quiet macro backdrop should be jet fuel for this market.
Indexes tested key support levels last week, with the SP 500 (SPY) bouncing off the 50 DMA on Thursday and recovering modestly. With the VIX at ~24 right now, plenty of "Vol Crush" fuel exists to power this market forward into year end, provided trade tensions are put on the back burner. Additionally, the 10YR Treasury Yield has come down dramatically over the last 3-6 months, and is now at the key 4% level largely fueled by lower oil and rent prices feeding into a disinflationary trend. This backdrop heading into the corporate buyback window should provide the legs needed to unlock higher levels this year like 700 and beyond. Below are 2 likely scenarios for how this plays out. The key inflection point will likely be how the ASEC Summit negotiations play out between Trump and Xi. Although promising rhetoric is being put out, until a flare up is confirmed NOT to have occurred, the market will likely retain some Volatility hedges to keep us relatively rangebound.
Below we will provide updates on select positions:
| Weight | Ticker | Avg Cost |
|---|---|---|
| 5.03% | TSLA | $296.83 |
| 4.77% | CAPR (SHORT) | $6.51 |
| 3.96% | PM | $518.91 |
| 3.73% | AMZN | $219.58 |
| 3.64% | QQQ | $518.91 |
| 3.04% | TGEN | $7.36 |
| 2.97% | QURE | $43.61 |
| 2.81% | ANET | $88.14 |
| 2.60% | GOOG | $205.43 |
| 2.55% | TIC | $13.70 |
| 2.39% | BMNR | $54.49 |
| 2.38% | SPRB | $125.14 |
| 1.96% | MRVL | $68.33 |
| 1.86% | ASML | $754.90 |
| 1.81% | ASPI | $8.92 |
| 1.79% | D | $50.02 |
| 1.79% | APP | $426.78 |
| 1.76% | JNJ | $162.37 |
| 1.67% | BTI | $37.66 |
| 1.66% | PSTG | $57.67 |
| 1.64% | TPB | $75.95 |
| 1.58% | ROK | $244.86 |
| 1.54% | ENTG | $89.41 |
| 1.53% | SRPT | $17.73 |
| 1.51% | META | $676.35 |
We will provide an update next month (11/23/25). Please follow our X Account for the latest @ap_analytics_cm. As always, feel free to reach out to anish@ap-analytics-cm.com to discuss any of these items.
Anish G. Prasanna
If you have not already done so, please read all disclaimers, as the following report is not intended as a financial recommendation.
This past week, investors received more clarity on the Federal Reserve's view on the economy through their release of the Summary of Economic Projections (SEP). This report was notable because core PCE was marked up YE2026 to 2.6 versus 2.4 in the June report. Meanwhile, their projects for Unemployment were left at 4.5 for 2025 and moved down to 4.4 for 2026. Lastly, the projected Federal Funds Rate (FFR) was revised down to 3.6 for 2025 compared to the June report, and 3.4 YE2026 compared to 3.6 in the June report. These changes suggest that the Federal Reserve is less tolerant of labor market weakness, while also becoming increasingly flexible on the inflation situation, which bodes well for additional rate cuts. In response to the SEP, yields, especially in the longer end did tick up, so it remains worth monitoring if the bond market will lose confidence in the Federal Reserve's decision making skills as this plays out. However, the Federal Reserve does have a tricky job at hand, given that the economic realities of the best companies in the world contained in the SP500 are markedly different than those busineses on Main Street. Specifically in cyclical industries like Housing, employment has largely tailed off, so rate cuts will be largely welcomed provided that the bond market has faith in the Federal Reserve's will to contain inflation.
Moving on to intermediate term market projections, unexpectedly, summer vol crush has continued to mid-september, passing the traditional seasonal period of low volatility. Post-September Op-Ex would be the last risk window for a strong pullback, but past that, several tailwinds (strong corporate earnings, Q4 corporate stock buybacks, institutional underperformance, positive wealth effect releveraging) exist to pull this market even higher towards targets like SPY 700. Even on a 3-5% pull back, upside OTM calls would be a good play towards year end.
Below we will provide updates on positions referenced last month in addition to some potential new positions we wish to accumulate on a downswing:
| Weight | Ticker | Avg Cost |
|---|---|---|
| 5.22% | TSLA | $296.83 |
| 4.36% | PM | $123.90 |
| 3.87% | QQQ | $518.91 |
| 3.74% | AMZN | $219.58 |
| 3.14% | BMNR | $54.49 |
| 3.14% | ANET | $88.14 |
| 3.04% | TGEN | $7.36 |
| 3.47% | GOOG | $199.95 |
| 2.28% | VTHR | $262.10 |
| 1.98% | TPB | $75.94 |
| 1.91% | ASPI | $8.92 |
| 1.86% | RDDT | $115.04 |
| 1.85% | BTI | $37.66 |
| 1.83% | D | $49.91 |
| 1.83% | UUUU | $7.85 |
| 1.82% | ALAB | $89.62 |
| 1.80% | ASML | $754.90 |
| 1.83% | ABAT | $1.94 |
| 1.77% | MRVL | $68.33 |
| 1.76% | FNMA | $10.66 |
| 1.76% | META | $676.32 |
| 1.70% | PSTG | $57.67 |
| 1.70% | OPEN | $6.68 |
| 1.68% | APP | $372.96 |
| 1.68% | ROK | $244.86 |
We will provide an update next month (10/19/25). Please follow our X Account for the latest @ap_analytics_cm . As always, feel free to reach out to anish@ap-analytics-cm.com to discuss any of these items.
Anish G. Prasanna
If you have not already done so, please read all disclaimers, as the following report is not intended as a financial recommendation.
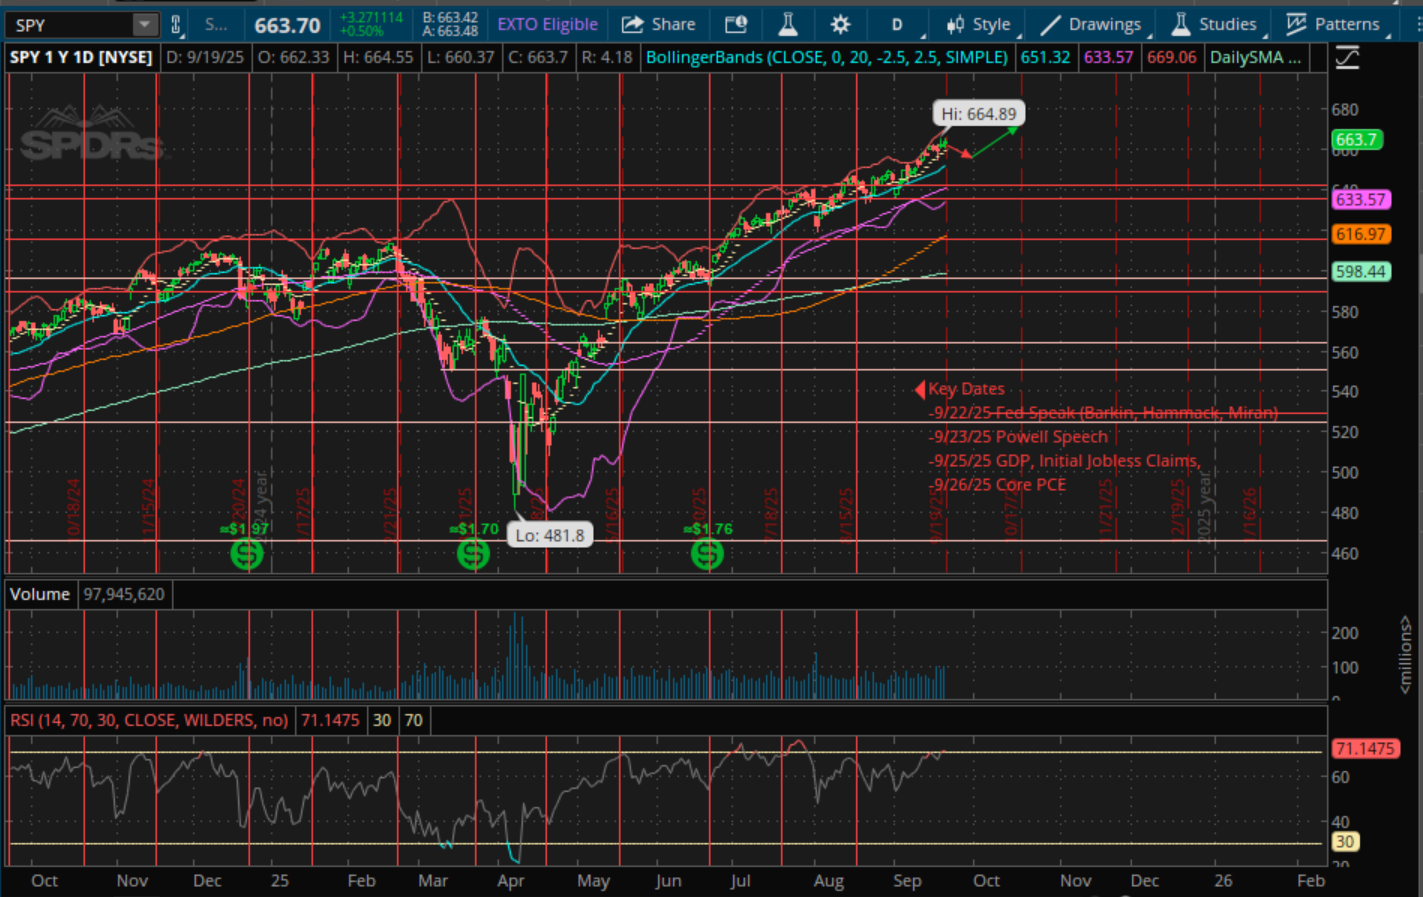
The macroeconomic picture continues to be somewhat stagflationary with big revisions to NFP for the months of May and June, suggesting that the labor market is rapidly cooling. Meanwhile, CPI for July came in at expectations, while PPI came in extremely hot at .9% MoM beating the .2% expectations. PPI traditionally has led CPI by a few months, which wouldn't be a great sign for those in the multi-cut camp. Given the inputs from PPI and CPI, a .25 cut in September is what the market expects with a follow-up cut sometime by the end of the year. The Jackson Hole Press Conference (8-22-25) should give us more clarity, but strategically it might not make sense to guide additional cuts given how uncertain the inflation picture is. In other words, the Fed seems to be in a box, where if they cut they risk inflation reaccelerating, but if they stand pat or are too slow to pull the trigger on follow-up cuts, they risk the labor market weakening in a non-linear manner. Given Powell's term length (less than 1 year now), the additional tariffs expected, and uncertainty about the inflation picture, it seems highly unlikely that Jackson Hole is to be as significant as previous years were. In any case, being hedged for a negative outcome would be prudent given historical negative seasonality during the August-October period, and the relatively cheap premium that exists at the moment.
Also notably, 13Fs were filed this last week. Warren Buffett took a position in UNH, NUE and several homebuilders including DHI and LEN. These look to be positioned to realize gains in preparation for the Federal Reserve's cutting cycle, which should unfreeze demand within the housing market. Similarly, Tepper also disclosed a position in UNH, and has it marked as his 2nd largest position, with BABA, AMZN, VST and NRG rounding out his top five. Coatue and Druckenmiller continue to be heavily positioned in the AI trade through MSFT, TSM, AMZN, META and GEV. Big Tech CapEx continues to grow as evidenced by their latest earnings reports, so these sectors should continue to be large beneficiaries as they realize productivity gains from reduced labor costs.
Moving on to intermediate term market projections, as expected, summer vol crush has continued to mid-August. August OpEx to September OpEx traditionally is a time for weaker market action, which would make sense given the macro context and the runup over the last several months.
Below we will provide updates on positions referenced last month in addition to some potential new positions we wish to accumulate on a downswing:
| Weight | Ticker | Avg Cost |
|---|---|---|
| 6.14% | ATYR (SHORT) | $5.00 |
| 5.92% | GLD | $292.16 |
| 4.67% | PM | $123.90 |
| 4.26% | TSLA | $296.83 |
| 3.91% | AMZN | $219.58 |
| 3.91% | QQQ | $518.91 |
| 3.60% | SPY 640 OCT 31 2025 PUTS | $13.00 |
| 3.02% | ANET | $88.14 |
| 2.74% | TGEN | $7.28 |
| 2.31% | VTHR | $262.10 |
| 2.07% | BTI | $37.66 |
| 2.01% | D | $49.91 |
| 2.00% | TPB | $75.94 |
| 1.93% | ASPI | $8.92 |
| 1.92% | RDDT | $115.04 |
| 1.86% | META | $676.32 |
We will provide an update next month (9/21/25). Please follow our X Account for the latest @ap_analytics_cm . As always, feel free to reach out to anish@ap-analytics-cm.com to discuss any of these items.
Anish G. Prasanna
If you have not already done so, please read all disclaimers, as the following report is not intended as a financial recommendation.
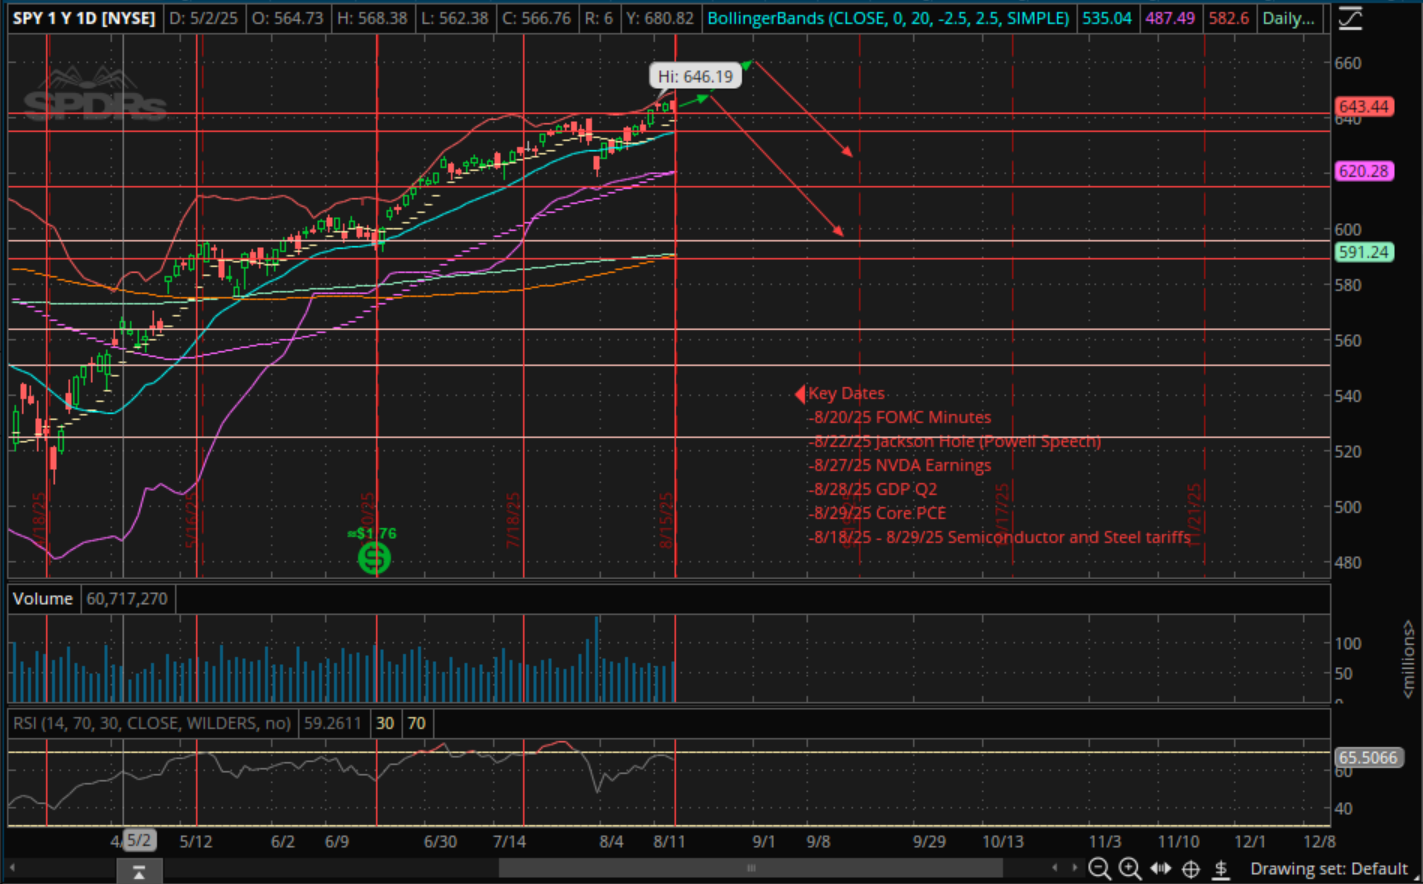
Overall, there continues to be several mixed signals on the overall state of the economy. Consumer retail sales exceeded expectations, but previous months were revised down, cooling continues in the residential real estate market and labor market, and the uncertainty with the trade war continues to dissuade the Federal Reserve from easing rates. Until these risks materialize in the earnings of the largest US Companies, the market is likely to continue to shrug them off given the lack of institutional positioning long, and more domestic certainty with the passage of the One Big Beautiful Bill, which extends the 2017 Tax provisions, removes taxes on tips, overtime, social security, expands the child tax credit, increases the SALT cap to 40,000, lowers the corporate tax rate to 15%, and allows for full expensing of manufacturing plants in addition to repatriation incentives. Overall, this should pave the way for earnings outperformance given the lower and removed guides from the previous quarter.
In other news, the race for the next Federal Reserve Chair continues. Leaks out of the White House suggest Kevin Hassett and Kevin Warsh as the two front runners, however market participants may not have confidence in long term inflation outcomes under a Hassett Chairmanship. President Trump stands the most to gain by appointing someone like current Governor Chris Waller, as it allows him the additional power of selecting his replacement. Reminder that the Federal Reserve Chair does not have sole discretion to set the Federal Funds Rate, but that it is voted on. An additional concern for Trump is getting his appointment through Senate, which Republicans only have a margin of 4 to work with. In any case, the market expects 2 rate cuts this year, so as long as Rent continues to deteriorate, inflation should remain subdued. Escalations in the trade war may provide the Fed with a convenient excuse so escalations on that front should be monitored closely.
Moving to market direction, summer vol crush is likely to continue to mid-August, but a small 1-3% pullback in the OpEx window to the end of the month would be expected. Given our current positioning, we will be using the next 1-2 months to return to a market neutral stance from our extended margin utilization. Additionally, we will be aggressive with multi-month hedges to protect from geopolitical, trade-war, fiscal and monetary concerns.
Below we will provide updates on positions referenced last month in addition to some potential new positions we wish to accumulate on a downswing:
| Weight | Ticker | Avg Cost |
|---|---|---|
| 7.74% | Oct 31 2025 SPY 600 PUTS | $11.85 |
| 6.21% | BRKB | $436.68 |
| 5.13% | GLD | $292.16 |
| 4.17% | PM | $117.83 |
| 3.59% | QQQ | $518.91 |
| 3.58% | TSLA | $294.22 |
| 2.32% | ANET | $88.14 |
| 2.13% | VTHR | $262.10 |
| 1.80% | OPEN | $1.00 |
| 2.01% | ASPI | $8.92 |
| 1.88% | AMZN | $213.12 |
| 1.80% | D | $49.91 |
| 1.77% | BTI | $37.66 |
| 1.71% | ROK | $244.48 |
| 1.68% | STIM | $4.35 |
| 1.65% | TGEN | $7.13 |
We will provide an update next month (8/17/25). Please follow our X Account for the latest @ap_analytics_cm . As always, feel free to reach out to anish@ap-analytics-cm.com to discuss any of these items.
Anish G. Prasanna
If you have not already done so, please read all disclaimers, as the following report is not intended as a financial recommendation.
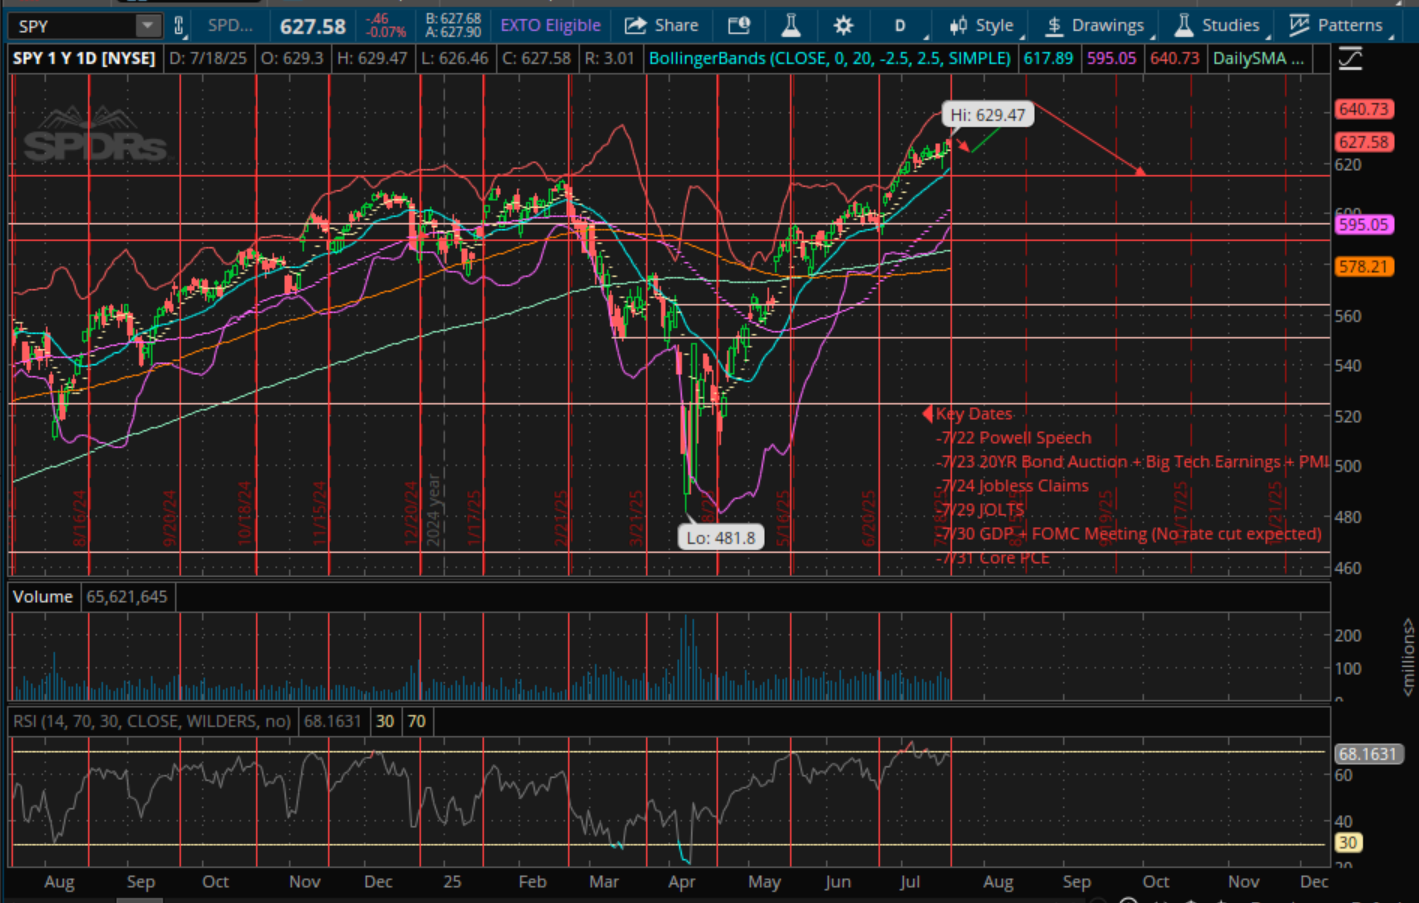
Recent developments in international relations between Israel, Iran and the US have moved to the forefront of the market conversation, however the global trade war, and recent actions by the Federal Reserve also loom large in the background. Despite these developments, the market has hovered around all-time highs due to unprecedented volatility compression. These effects should persist until the late July - early August timeframe, after which a larger pullback may emerge. The Iran-Israel conflict tracks to continue to escalate after the 3 airstrikes on the Fordow, Natanz and Isfahan nuclear facilities. Iran has several potential options in responding including closing the Strait of Hormuz, activating the Houthis to close the Red Sea and/or attack the Saudi Oil Fields, and attacking US military assets in the region. Involvement of Russia and China also remains on the table, but these are low probability resolutions. The critical aspect with respect to markets is the effect on oil prices, and in turn, the 10 yr treasury yield. Sudden spikes in oil prices are a common prelude to recessionary conditions since energy is an input cost to nearly everything in the economy. This escalation may provide an off-ramp for the trade war, particularly with stakeholders like the EU and Japan, since some element of international cooperation is required to push for objectives like regime change. Seemingly, the only picture getting clearer is the Federal Reserve's stance on the macroeconomic conditions. Based on their latest Summary of Economic Projections, their benchmark for providing rate cuts continues to get higher and higher, due to their uncertainty with inflation related to the trade war. 2 cuts remains the market's expectation for this year, but it seems increasingly likely a strong deterioration in the labor market is needed to get there.
Moving to market direction, a small 1-3% pullback in the OpEx window to the end of the month would be expected. Given our current positioning, we will be using the next 1-2 months to return to a market neutral stance from our extended margin utilization. Additionally, we will be aggressive with multi-month hedges to protect from geopolitical, trade-war, fiscal and monetary concerns.
Below we will provide updates on positions referenced last month in addition to some potential new positions we wish to accumulate on a downswing:
| Weight | Ticker | Avg Cost |
|---|---|---|
| 6.68% | BRKB | $436.68 |
| 5.42% | GLD | $292.16 |
| 4.44% | PM | $116.95 |
| 3.54% | QQQ | $518.91 |
| 3.25% | TSLA | $291.57 |
| 1.64% | Jul 18 2025 SPY 600 PUTS | $12.38 |
| 0.7% | Jun 18 2026 SPY 540 PUTS | $20.75 |
| 2.12% | VTHR | $262.10 |
| 2.01% | PSIX | $30.00 |
| 1.89% | ANET | $88.14 |
| 1.76% | BTI | $37.66 |
| 1.77% | D | $49.91 |
| 1.76% | Jun 17 2027 AMZN 200 CALLS | $35.40 |
| 1.70% | BUD | $58.02 |
| 1.62% | UNH | $404.36 |
We will provide an update next month (7/20/25). Please follow our X Account for the latest @ap_analytics_cm . As always, feel free to reach out to anish@ap-analytics-cm.com to discuss any of these items.
Anish G. Prasanna
If you have not already done so, please read all disclaimers, as the following report is not intended as a financial recommendation.
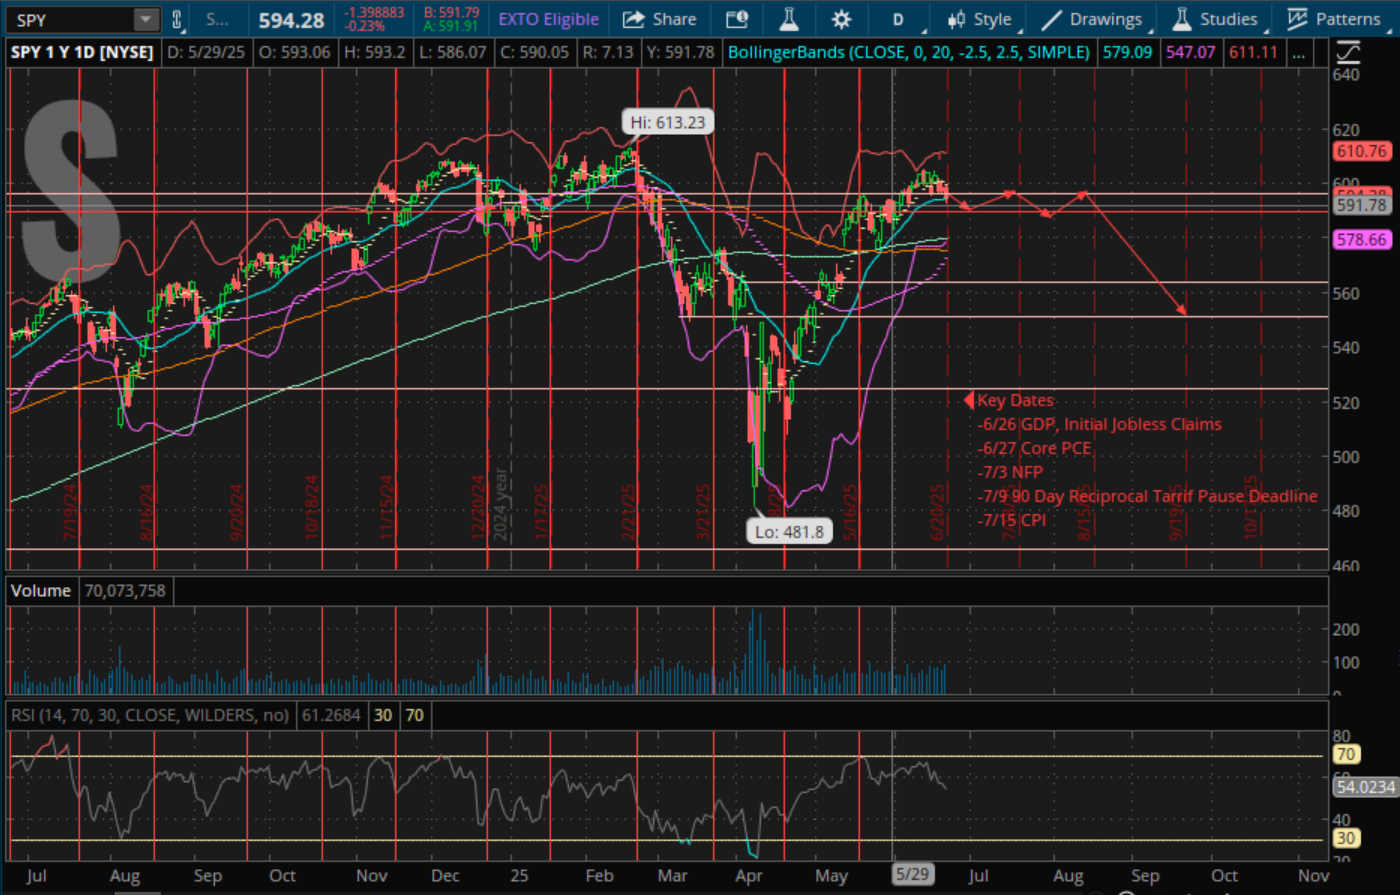
Trade negotiations around tariffs continue to dominate the economic news. To recap, Liberation Day (4/2/25) enacted reciprocal tariff rates loosely based on the existing trade deficits between the US and other nations. These numbers were much larger than anticipated, with most notably a 54% rate on China. This number was then boosted to 145% on April 9th, before a deescalation on May 12th to 30% for 90 days, pending further negotiations between the two nations. We lean towards an outcome wherein a framework resolution will be agreed upon that prevents a number above a ~50% effective rate, as this number would be representative of a near trade embargo. However, a floor of 10% seems to also exist based on Peter Navarro's comments earlier this month. In general, this exercise proves our earlier claim that significant dips in the market will draw strong economic actions by the Trump administration, presenting long term buying opportunities. With that being said, portfolio protection for volatility should be held to opportunistically position for this market period. Another key issue, is the outcome of the US budget discussions. Higher deficits will cause longer term yields to increase, although these dollars will largely be eventually consumed by publicly traded companies, so expect more market inequality that may ultimately benefit the major indices. Lastly, on Friday (5/16/25), Moody's officially downgraded the US sovereign credit rating from AAA to AA1 due to the rising government debt load and the interest required to service that debt. The timing of this downgrade might throw a spanner in negotiations over the new budget, potentially bringing the ceiling down and reducing some of the administrations goals like no tax on tips, or overtime, etc. The 10YR Treasury Yield has been skyrocketing since April 30th from 4.17% to now 4.44%. A break over 4.5% would be a headwind to equities, given how extended the rebound has been since the April 8th bottom.
This last week, Q12025 13Fs were released. Although this was before recent developments on the trade front, several funds made interesting moves. Berkshire bought $STZ, $POOL, $DPZ, $SIRI and $OXY. Stanley Druckenmiller added positions in $TEVA, $DOCU (which we like here on a dip), $TSM, $FLUT, $ISM. Lastly, Coatue added to $CRWV, $BABA, $LRCX, $PM (a portfolio favorite of ours), and $SPOT.
Moving on to market direction, outcomes continue to largely be headline driven but given the recent strength seen over the last few weeks, some retraction would be expected at this OpEx window.The June OpEx cycle is a quite a large one, so the following few days until the end of month are critical in outlining the future path.
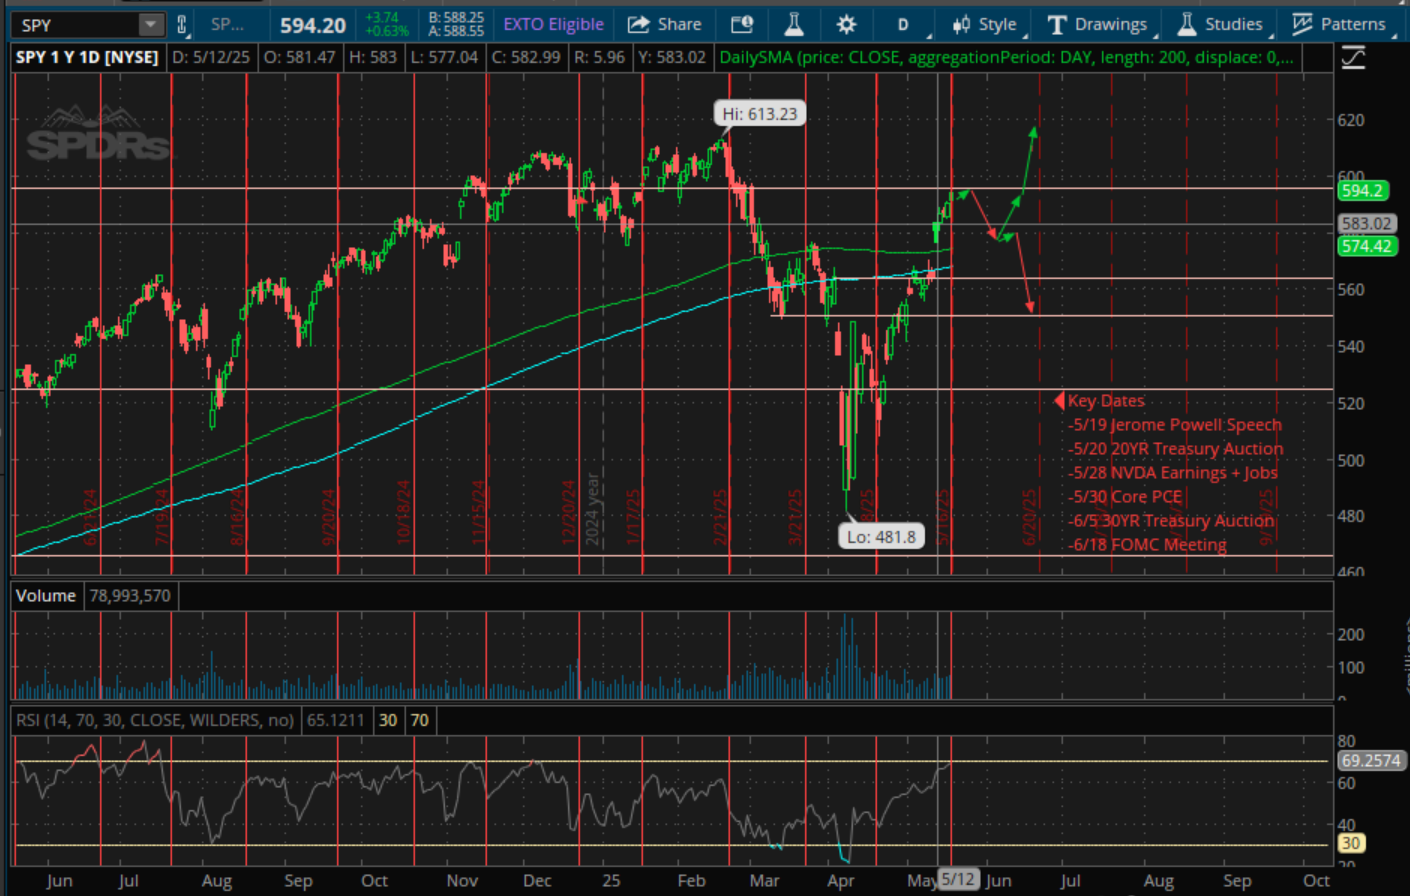
Currently, our base case is a test of the 100DMA and 200DMA at 574 and 571. A break of that could lead to continuation down to the Liberation Day close of 564. Below that, further critical levels of support would be 556 and 545. Failure to break the election gap of 576 by the end of the month would position us to push the ATH of 612 by June Opex.
Below we will provide updates on positions referenced last month in addition to some potential new positions we wish to accumulate on a downswing:
| Weight | Ticker | Avg Cost |
|---|---|---|
| 12.72% | Jun 18 2026 SPY 500 PUTS | $22.19 |
| 8.67% | BRKB | $436 |
| 6.17% | GLD | $291 |
| 5.05% | PM | $117 |
| 2.81% | Jan 16 2026 TLT 85 PUTS | $4.55 |
| 1.84% | Jan 15 2027 TLT 90 PUTS | $9.95 |
| 2.31% | TSLA | $268 |
| 2.22% | D | $49.91 |
| 2.06% | Jun 17 2027 AMZN 200 CALLS | $35.40 |
| 1.97% | BUD | $58 |
| 1.91% | ROK | $183 |
| 1.88% | Jun 17 2027 ADI 230 CALLS | $44.70 |
| 1.88% | BTI | $37.66 |
| 1.85% | Dec 19 2025 MAGS 60 CALLS | $1.70 |
| 1.81% | STIM | $4.68 |
We will provide an update next month (6/22/25). Please follow our X Account for the latest @ap_analytics_cm . As always, feel free to reach out to anish@ap-analytics-cm.com to discuss any of these items.
Anish G. Prasanna
If you have not already done so, please read all disclaimers, as the following report is not intended as a financial recommendation.
The balance of risks to the market continues to remain uncertain, however we believe that in the short term volatility will be capped as we enter a period of a grind up for the next few weeks. The trade war continues to dominate the financial news, however recent happenings at the Federal Reserve and Treasury have been quite illuminating. Last week (3/19/25), the latest Summary of Economic Projections (SEP) was released. Interestingly, year end projections were revised down for GDP from 2.1% to 1.7%, Unemployment expectations from 4.3% to 4.4%, and Core PCE from 2.5% to 2.8%, all while 2 cuts continued to projected. In other words, this signaled a lower tolerance for a slowdown in growth, than a rise in inflation in our opinion. Furthermore, QT was winded down from 25 billion a month to 5 billion a month which the bond and equity markets loved. Leading indicators continue to be mixed about whether or not a recession is in the horizon, but it seems clear that the Fed is in tune to any risks on growth ahead, making us opportunistic on larger drawdowns in equities. Scott Bessent (US Treasury Secretary) has been conducting numerous interviews on Cable Networks and Podcasts describing his vision of the US Economy in great detail. In his view, the US Debt and Deficit are unsustainable and the past few years have devastated the working class through the erosion of the purchasing power of the US dollar. His priorities are to bring down US Federal Debt in a controlled manner to 3% Deficit:GDP, deregulate the Financial System to allow the private sector to releverage up and reorder global trade to bring back American Jobs via Tariffs, low and predictable taxes and an accommodative regulatory environment. Our personal feeling is that over the next 3-6 months, this administration would welcome a recession if it happens although it remains unclear if this is their intent. The primary reason for this, is that the 5 year anniversary of ZIRP is approaching, and Private Equity, Venture Capital, Publicly Traded Companies, and the US Treasury are looking to refinance at lower rates. A recession would provide the pretext for rates to come down and QE to be restarted ushering in another growth cycle for the US economy. If this is the path this administration wishes to follow, a lower risk investment strategy is advisable for us, which we are looking to transition to at an appropriate stage.
There are quite a few different paths that the market can take over the next few weeks, but as we got our 8-12% decline until March OpEx that we expected, we now look for another upswing/consolidation for the next few weeks. This path largely hinge on the key events listed in the chart, in particular how the trade war plays out. April 2nd should provide more clarity. Ideally, we get a resolution for the majority of nations with tariff capitulation, however the 2nd best scenario would be an immediate raise without retaliation from the rest of the world. The worst scenario (at this time), would be another push in the deadline, leaving more uncertainty about the trade war and potential escalations.
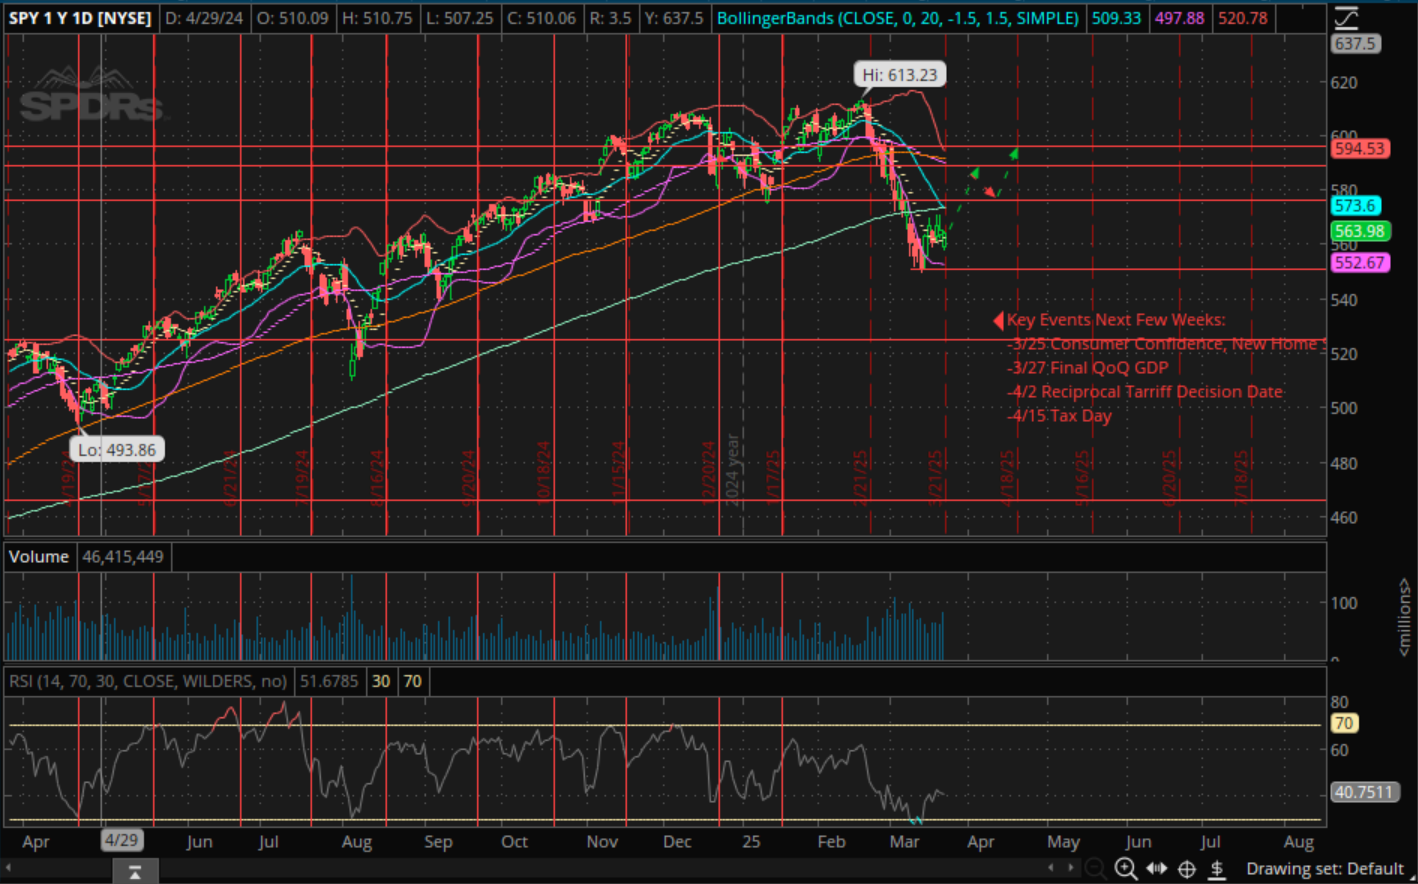
As called out in last month's update, the decline we expected caused our puts to appreciate significantly, allowing for additional capital to be raised to rebalance the fund to better face the anticipated headwinds with a potential slowdown in growth. Although, this isn't certain, the odds of growth slowing down are elevated due to Tariffs, a reduction in federal,state and local spending and the labor market already cooling. Due to tax season approaching, a retest of SPY 550ish is certainly possible, but we largely expect a bounce due to oversold conditions to at least the election gap and/or the yearly open at 577 and 590 respectively. If we have that 550 retest, we will look to add multi-month calls, otherwise we will continue to sit tight with dry powder handy for another round of puts when the situation calls. We do think that this decline is largely played out with sentiment extremely low, and with VIX showing the hallmark short term doubletop, we should begin to see a rangebound SPY that grinds higher. Options aren't the best tool here given how high IV has been jacked up, but we do anticipate some opportunities to present themselves in the coming weeks, once things cool down.
Below we will provide updates on positions referenced last month in addition to some potential new positions we wish to accumulate on a downswing:
| Weight | Ticker | Avg Cost |
|---|---|---|
| 3.43% | BRKB | $408 |
| 2.99% | STIM | $4.24 |
| 2.74% | NVDA | $118 |
| 2.65% | QQQ | $501 |
| 2.58% | TSLA | $249 |
| 2.35% | PLTR | $29 |
| 2.31% | PM | $117 |
| 2.24% | MSFT | $376 |
| 1.88% | GOOGL | $179 |
| 1.87% | TKO | $112 |
| 1.79% | AMZN | $183 |
| 1.54% | CB | $275 |
| 1.37% | ASML | $733 |
| 1.29% | AAPL | $184 |
| 1.19% | HD | $359 |
We will provide an update next month (4/20/25). Please follow our X Account for the latest @ap_analytics_cm . As always, feel free to reach out to anish@ap-analytics-cm.com to discuss any of these items.
Anish G. Prasanna
If you have not already done so, please read all disclaimers, as the following report is not intended as a financial recommendation.
The balance of risks to the market continues to remain volatile. As discussed in our inaugural report, Federal Spending has seemed to be the bedrock of the Economy over the past several years. However, with DOGE's early successes in reducing the 1.8 Trillion deficit, this stability is now potentially threatened. In 2024, total US spend was 6.75 Trillion, comprising of 3.5 Trillion for entitlements, 1.1 Trillion for Interest on Debt and 2.1 Trillion for Defense + Discretionary. To balance the annual deficit without touching entitlements and Debt Interest, 86% of defense + discretionary spending would need to be cut, which would cause a massive economic shock. This seems highly unlikely, but in any case, with the labor and housing markets cooling, and inflation concerns reaccelerating with leading indicators like copper futures jumping, there are certainly concerns to the market that should be hedged appropriately. This is all with a backdrop of a Federal Reserve that remains in a reactionary posture (as opposed to a proactive one) in that they are waiting for clear signs of issues before making a move to cut rates. Lastly, we are nearing the 5 year mark of COVID-19 ZIRP debt financing. This debt expiring negatively impacts liquidity in the credit and financial markets. Although till this point we have only enumerated downside concerns, we are not suggesting that there are no reasons for optimism, rather that hedging is extremely important to protecting long term capital growth.
There are quite a few different paths that the market can take over the next few weeks, but we are placing the base case as a 8-12% decline until March OpEx as outlined below. These paths largely hinge on the key events listed in the chart, but also on how events shape out globally in Europe, Japan, China, etc. German Elections look to largely suggest that economically populist policies may remerge potentially contributing to a change in currency dynamics. Similarly in Japan, the Yen continues to appreciate which is a headwind to US Equities. Favorable results for NVIDIA on Wednesday could provide the ingredients for another rally, however it is critical to note that this quarter post-earnings bumps have been muted on upside surprises and below-expectation results have caused bigger than usual downswings in stock prices.

Due to the risks mentioned above and weak seasonality post February OpEx, we have opened a tranche of PUT options at the 600 Strike for April 30th 2025 at 11.61. The fund remains largely long, but we are actively looking to reduce long side exposure by rebalancing the positions mentioned below. Downside targets to SPY that we are looking at to begin montezing the Puts include the 589 Yearly Open, the 576 Election Gap, the 2023 October AVWAP at 524 and October 2022 AVWAP at 465. It's largely unlikely that we have a down swing past 10% at this juncture, so at this time the target is 576 to unload the Put Position. If SPY breaks above 615, we'd look to remove these puts and rebuy at a further expiry and strike during a rip in early March or early April. However, we strongly feel that a 8-12% correction is due before another rally can be catalized by the Federal Reserve, or the Government. In such a case, we would expect that the Fund's results underperform market benchmarks like the SPY, QQQ and IWM temporarily until the subsequent rally occurs.
Below we will provide updates on positions referenced last month in addition to some potential new positions we wish to accumulate on a downswing:
| Weight | Ticker | Avg Cost |
|---|---|---|
| 2.9% | NVDA | $75 |
| 2.9% | TSLA | $252 |
| 2.6% | 600 SPY APR 30 2025 PUTS | $11.61 |
| 2.5% | PLTR | $29 |
| 2.4% | STIM | $4.24 |
| 2.2% | MSFT | $376 |
| 2.0% | PM | $113 |
| 2.0% | BRKB | $366 |
| 1.5% | TKO | $105 |
| 1.4% | IDR | $13.66 |
| 1.4% | GOOGL | $182 |
| 1.4% | AAPL | $183 |
| 1.3% | ASML | $733 |
| 1.2% | QQQ | $520 |
| 1.2% | AMZN | $175 |
We will provide an update next month (2/23/25). Feel free to reach out to anish@ap-analytics-cm.com to discuss any of these items.
Anish G. Prasanna
Happy New Year to all of our readers!
If you have not already done so, please read all disclaimers, as the following report is not intended as a financial recommendation.
In 2024, the fund achieved a 57% growth on investment greatly surpassing expectations and the S&P500, QQQ, and IWM benchmarks of 25%, 26%, and 11% respectively. The coming year will likely be more challenging from a macro economic perspective but often times these present the greatest long term rewards.
Over the next few weeks, we expect to see a key inflection point develop as we gain more clarity on the incoming administration's implementation on trade, immigration and national security. A key heuristic to monitor as this situation develops will be the 10 Year Treasury Yield ($TNX), which should act as a several month leading inverse indicator of economic strength (as it historically has). Simply put, bulls do not want to see spikes resume on the 10 yr, after the good housing data we received on Friday which temporarily alleviated concerns of a slowdown in the housing sector pertaining to residential home builders. In addition, we received good earnings data from the US banks and are awaiting MAG7 earnings starting in 2 weeks. Between these earnings, a new administration, the Bank of Japan interest rate decision on the night of 1/23 (remember the carry trade implosion?), and corporate stock buybacks resuming on the 24th, this is largely a developing and dynamic situation that is worth monitoring. Both the magnitude and order of these policy decisions are important as we enter this new market regime. In short, we expect the range of outcomes to broadly expand under the Trump administration, and we will, therefore, position accordingly.
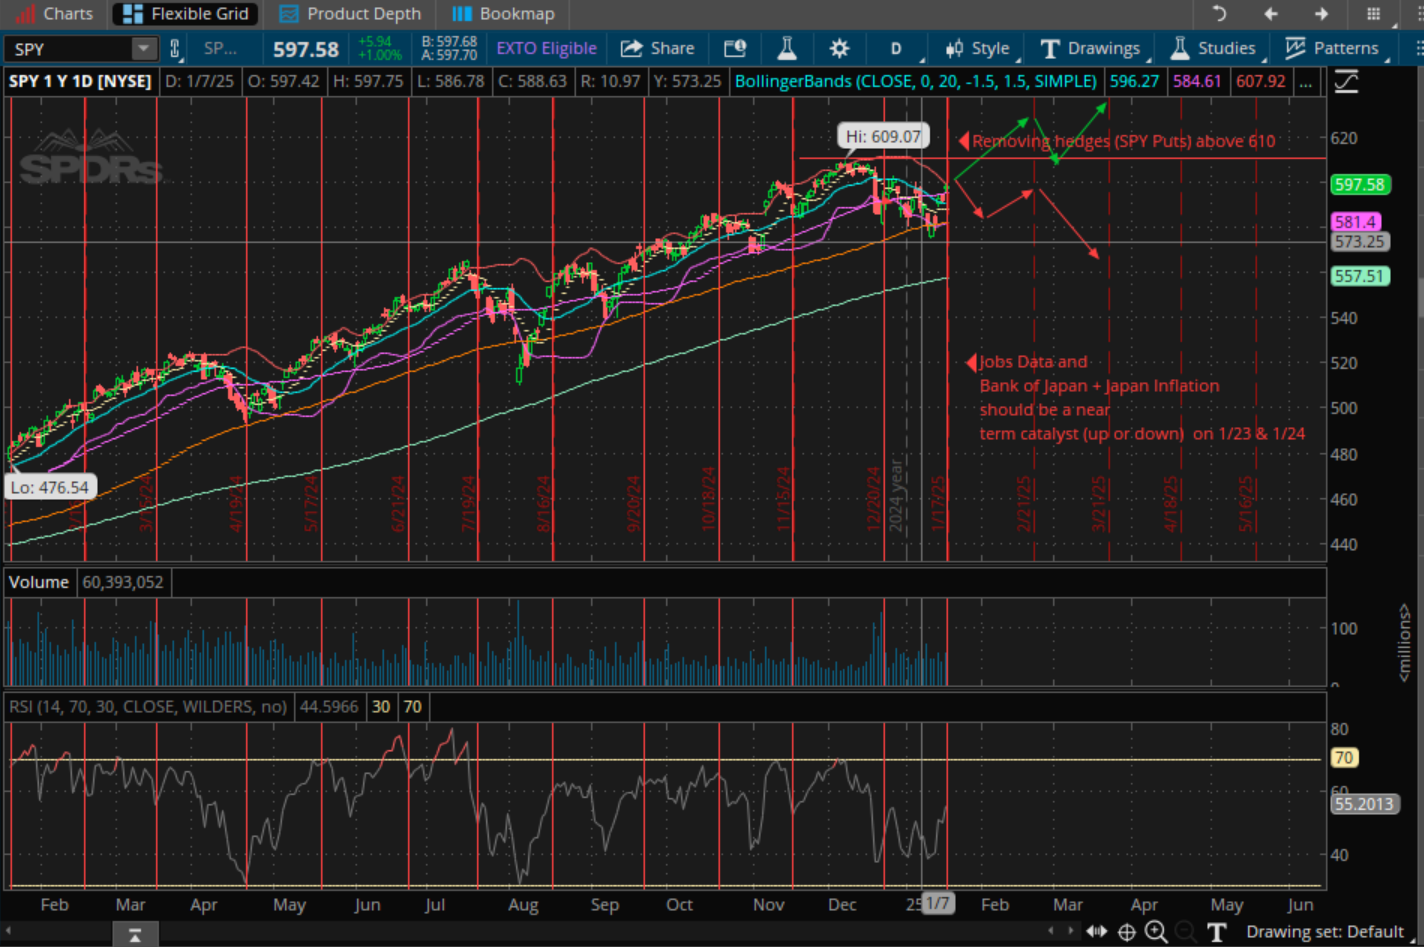
As our last update correctly laid out, we have largely trended upwards since december OpEx (12/20). However, given the expected potential volatility ahead we have added SPY Puts at the 585 strike for the March 31 2025 Expiry at a cost basis of 10.26. At this time, the fund is still positioned long (albeit less so), and we are actively looking to get it closer to neutral if we continue to chop until month end and the 10 yr yield reverses the Friday move. A move to the 100 day moving average (581) or even 200 day (557) would make logical sense over the next few weeks and would be good multi-month buys. President Trump views the stock market as a metric on the performance of his administration so pullbacks will be good opportunities to add.
Below we will provide updates on positions referenced last month in addition to some potential new positions we wish to accumulate on a downswing:
| Weight | Ticker | Avg Cost |
|---|---|---|
| 3.3% | TSLA | $228 |
| 3.1% | NVDA | $73 |
| 2.5% | 585 SPY Mar 25 PUTS | $10.26 |
| 2.5% | MSFT | $376 |
| 2.5% | BIL | $91.56 |
| 2.1% | BRKB | $366 |
| 1.9% | PLTR | $29 |
| 1.7% | GEO | $11.65 |
| 1.7% | PM | $113 |
| 1.5% | ASML | $733 |
| 1.4% | IDR | $13 |
| 1.4% | TKO | $99 |
| 1.2% | AAPL | $177 |
| 1.1% | CB | $272 |
| 1.1% | D | $49.91 |
We will provide an update next month (2/23/25). Feel free to reach out to anish@ap-analytics-cm.com to discuss any of these items.
Anish G. Prasanna
This report will attempt to outline a few potential market pathways for the start of 2025, given the latest economic data and the forward guidance from the Federal Reserve provided by the Summary of Economic Projections (SEP). If you have not already done so, please read all disclaimers, as the following report is not intended as a financial recommendation.
The media and markets initially had an extremely bearish reaction to the FOMC meeting on 12-18-24. The SP500 (SPY) immediately shot down after the 2PM release and continued to trend down to ~585 from ~603 (-3%). Technically, this did do some damage as the index broke below the 8, 10, 20 and 50 DMAs. In addition, Gold and Bitcoin also made big moves down, while Yields shot up (TNX).
Although the Federal Reserve did cut 25 basis points, the forward guidance they provided only suggested 2 cuts for the entirety of 2025 and 2 cuts for 2026. This pivot in monetary policy to a more cautionary rollback of rates is what shook the markets. However, digging deeper into the SEP points us to, in our view, a much more reactive Fed to any weakness in the labor market while also attempting to take out some froth in the markets in anticipation of the incoming administrations fiscal and trade policies (perceived to be inflationary). In other words, we think that this is a good move AS LONG AS the Fed is reactive to deterioration in the labor markets, particularly in the housing sector. The evidence of this can be seen in their adjustments of the Unemployment Rate, Real GDP, Core PCE Inflation and Federal Funds Rate (FFR). In short, they moved up projected year end 2025 FFR from 3.4 (what they projected in september) to 3.9 (bearish in the short term) and increased their year end 2025 tolerance of core PCE inflation by moving up (bullish) to 2.5 from 2.2 (what they projected in september), while also moving down their tolerance for a detoriation in the labor market by moving down year end 2025 Unemployment to 4.3 from 4.4 (projected in september). Given that the unemployment rate is already at 4.2, the bar of cutting more than 2 times is now just an increase of .1%. Said simply, since September, the Fed is less tolerant of volatility in the labor markets in comparison to economic price stability (inflation) - but they are penciling in fewer cuts. Nonetheless, these actions do put the economy at greater risk of a recession in a pursuit to engineer a perfect outcome (i.e. no reacceleration of inflation).
The primary reason we feel confident that the Federal Reserve is looking to support the labor market more so than is priced in by their SEP is from the recent history of the Powell Fed. Below are 3 graphs charting SEP projections (FFR, Core PCE, and Unemployment) since 2018. A sample of 6 is obviously not statistically significant, however it's important to note that the SEP projections have never really panned out (granted that would be a high bar). Therefore, these projections are best understood as a tool of the Fed to achieve current policy objectives.


With the current market focus being on the Federal Reserve, it is critical to understand that fiscal policy, trade and corporate earnings is what is essential to monitor here to understand market dynamics moving forward. Given the lower threshold for labor weakness, in particular, homebuilders are what we are choosing to drill down on at this time. Earnings in this sector have been mixed, but the entire sector has shown weakness (i.e. XHB) particularly over the last month. Profit margins have been getting squeezed for these companies as they now need to incentivize more than before for potential buyers due to mortgage rates sticking between 6-7%. New homes sales data is what needs to outperform in order for the labor market to remain stable. If the new homes market continues to deteriorate, homebuilders will begin layoffs from the record highs they are currently employing. Its also important to note that if housing completions continue to trend higher than housing permits and housing starts, there is an upside risk to Unemployment. Given that these risks have increased due to the markets reaction to the Fed's SEP, we are choosing to increase our allocation into TLT from 0% to 2.25% as a multimonth trade anticipating another Federal Reserve Pivot by the middle of next year.
Nearer term, we are beginning to see some weakness across all indices (DIA, QQQ, SPY, IWM). In particular, IWM has not had a good time since the election as rates have continued to trend up. Small and Mid-Caps will be a tricky trade, so we will steer clear of that. As mentioned above, the economy is at an elevated risk of a growth scare over the next two quarters, but we continue to be optimistic about US equities over the longer run so our positions will remain on, but we are looking to tactically hedge in mid January and/or mid February to decrease the fund's downside risk during such a drawdown. Before that, however, our base case is that a Santa Rally occurs taking us to at least 600 again on the SPY (base case depicted in red + red/yellow below). After that, we look to place small hedges (1-2% size at out of the money strikes) to take advantage of any volatility over the next couple weeks.

The multimonth trade that we are targeting is a move to the 100DMA (571) and/or 200DMA (548) in January/February as buyable dips that should hold for the long term bull trend. We are looking to opportunistically dollar-cost-average if the 100DMA is reached and aggressively add if the 200DMA is reached.
Below we will provide updates on positions referenced last month in addition to some potential new positions we wish to accumulate on a downswing:
| Weight | Ticker | Avg Cost |
|---|---|---|
| 7% | SPY 590 Calls Jan 21 2025 | $11.90 - w/ 30% trailing stop |
| 3.5% | TSLA | $218 |
| 3.4% | NVDA | $71 |
| 2.8% | MSFT | $376 |
| 2.4% | PLTR | $28 |
| 2.3% | BRKB | $366 |
| 2.2% | TLT | $88 |
| 1.6% | GOOGL | $180 |
| 1.6% | GEO | $11 |
| 1.6% | ASML | $733 |
| 1.6% | TKO | $99 |
| 1.6% | AAPL | $177 |
| 1.4% | IDR | $13 |
| 1.4% | CB | $272 |
| 1.4% | AMD | $146 |
We will provide an update next month (1/19/25). Until then, feel free to reach out to anish@ap-analytics-cm.com to discuss any of these items. Happy Holidays, Merry Christmas and a Happy New Year!
Anish G. Prasanna
This report will attempt to outline a few potential market pathways for the rest of the year, and provide our thoughts on a few different companies that could be uniquely positioned to outperform during this market regime. If you have not already done so, please read all disclaimers, as the following report is not intended as a financial recommendation.
The current economic cycle has proven to be quite anomalous in comparison to the last several decades. Numerous “Market Wizards” predicted a recession in 2022 due to rate hikes, although the market did experience a downturn, it also had the quickest bear market recovery (since 1990). All in all, it lasted for a total of 282 days, and led to returns in 23 and 24 YTD of 26.19% and 26.68% (SPY).
Several structural dynamics and tailwinds emerged that could have explained the miscalculation. These factors are listed below:
Ultimately, although these market tailwinds exist and could be expanded through the Trump administration (i.e extension/expansion of the 2017 Tax Cuts and Jobs Act), There also exist numerous headwinds that are projected to have an increasing impact on the economy and market conditions moving forward including:
Nearer term, event volatility unwind from the November 5th election produced a sizable rally across all 4 major indices (SPY, QQQ, DJIA, IWM). This trend is likely to continue as we have tailwind flows of Vanna, Charm around the largest yearly expiration date of 12/20, in addition to seasonal tailwinds associated with releveraging and the corporate stock buyback window reopening. These flows will likely be front run even before they are realized. These tailwinds will be particularly strong from the period of 12/2 until 1/1, Below are a few potential scenarios (illustrated in red white and green) for SPY:
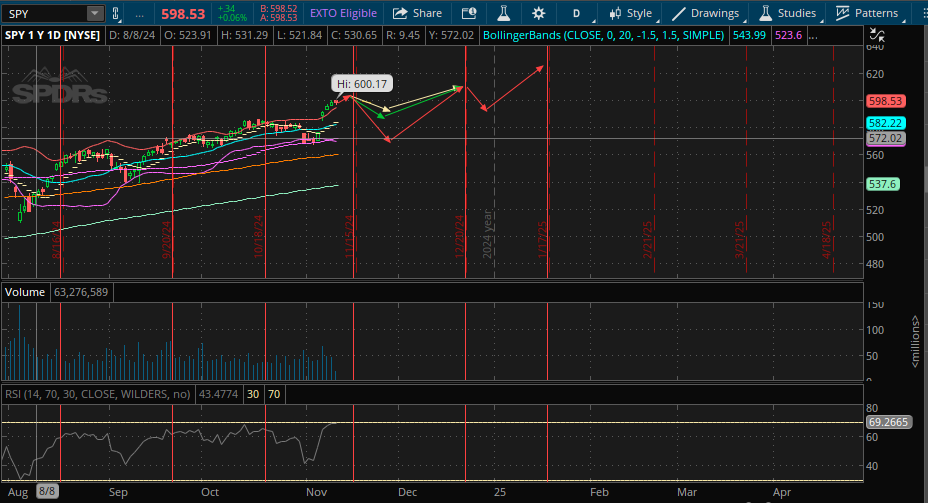
Ultimately, we anticipate a move to the 100DMA (560) and/or 20DMA (582) as buyable dips for an upwards swing into mid January. Accumulation (dollar cost averaging) during the post-opex windows (the start of each window is marked by the red vertical lines and run until the end of month) is how we intend to execute this move by targeting the March 21 2025 expiries at OTM strikes (preferably lower IVs ~10).In particular, the date of 11/21 marks a seasonal bottom during election years. This position is intended to be unwound around January 17th, at which point we will reassess the bond, volatility, and equities markets to position unallocated capital.
Additionally, we intend to target the following stocks with favorable thematic characteristics to accumulate shares into this upswing as long term holds for the forseeable future.
We will provide an update next month (12/22). Until then, feel free to reach out to anish@ap-analytics-cm.com to discuss any of these items.
Anish G. Prasanna